Antispoofing Performance Metrics: Role, Types, Standards
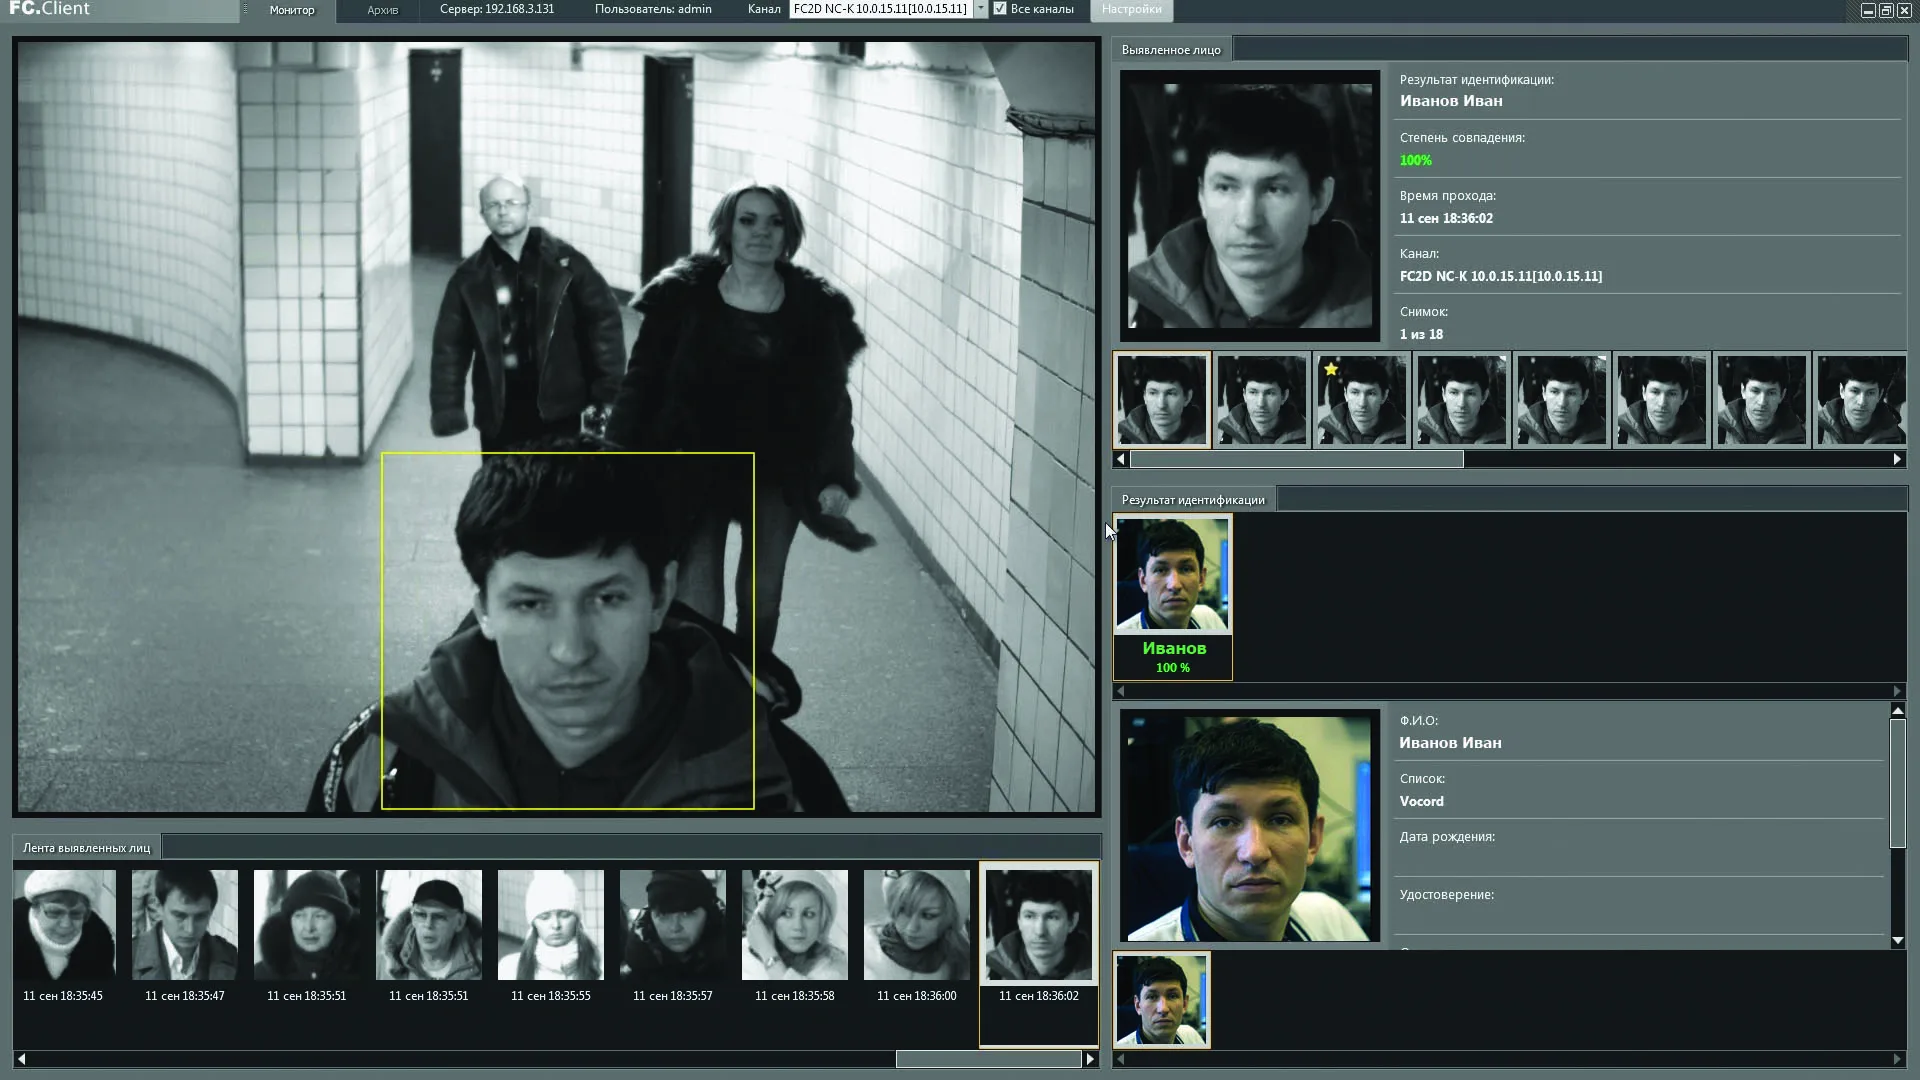
Performance metrics and liveness standards play an important role in the testing of biometric systems. They help to reveal error rates, execute a full-scale security test and eradicate possible vulnerabilities. Common errors in a biometric system occur when a detection system fails to recognize biometric data. (Facial features, head volume and contours in the case of facial recognition).
The groundwork for the metrics is provided by the following standards:
In simple terms, these metrics help evaluate whether a detection system is able to effectively prevent Presentation Attacks (PAs).
To ensure that test results are accurate, two central evaluation parameters are proposed:
- Attack presentation classification error rate (APCER)
- Bona fide presentation classification error rate (BPCER)
ISO Metrics for PAD System Evaluation
The PAD system evaluation, as mentioned in the liveness taxonomy, includes various rate-based metrics. Their purpose is to assess the "readiness" of a system to identify a bona fide presentation attack, its instruments, attack frequency and error rate. The evaluation also examines and evaluates the subsystems of a PAD system as a test subject.
The metrics cover the following factors:
- Test subject number
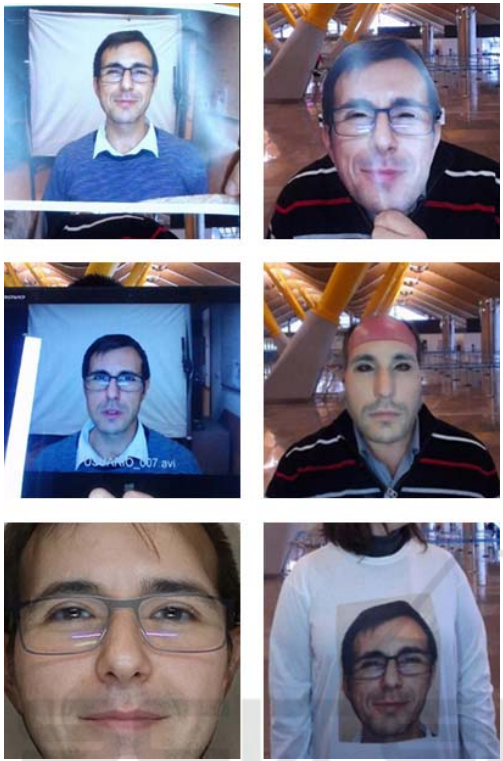
- Presentation attack instruments and species
- Artifact and present non-conformant characteristics
- Description of output information provided by the PAD system
The end goal of the evaluation is to reveal whether a biometric system — as well as its subsystems — can successfully detect a presentation attack.
There are a few principal metrics types.
Classification Metrics
This type involves APCER and BPCER evaluations.
APCER is used to calculate PAI species (PAIS) with this formula:
[math]\displaystyle{ APCER_{PAIS}=1-\left ( \frac{1}{N_{PAIS}} \right )\sum_{i=1}^{N_{PAIS}}Res_i }[/math]
- [math]N_{PAIS}[/math] — The attack presentation number for a specific PAIS.
- [math]Res_i [/math] — If at least one presentation turns out to be an attack, it takes value 1. If not, it retains value 0.
The evaluation assesses the accuracy of the biometric system in the form of: (a) correctly classified and, (b) incorrectly classified results. Parameters evaluated on the basis of PAI series, by capture subject and species are also be specified.
Next, the PAD’s subsystem is tested. The test evaluates how well a subsystem detects PAIS in the context of a specific Attack Potential (AP). This implies reporting an accurate number of artifact presentations.
The following formula is used for this purpose:
[math]\displaystyle{ APCER_{AP}=\max_{PAIS\in{A_{AP}}}\Bigl(APCER_{PAIS}\Bigr) }[/math]
- [math]A_{AP}[/math] — A PAIS subgroup with a certain attack potential.
The attack potential is estimated with the help of ISO/IEC 19989.
The second type of evaluation, BPCER is used for calculating and reporting bona fide presentations using the following formula:
[math]\displaystyle{ BPCER={\textstyle \sum_{i=1}^{N_{BR}}Res_i\over {N_{BF}}} }[/math]
- [math]N_{BR}[/math] — Amount of the bona fide presentations.
- [math]Res_i[/math] — Again, it assumes value 1 if at least one PA attempt is registered. Otherwise, it retains value 0.
As a result, the reported bona fide presentations are classified correctly or incorrectly. (by total amount or by capture subject)
One essential clause states that APCER and BPCER test results cannot be put into an aggregate report. However, it is possible to report a PAD system’s performance as a BPCER figure accompanied by a specific APCER.
Non-response Metrics
As noted by the facial Antispoofing Wiki, non-response metrics evaluate instances when the PAD system is unable to detect a presentation attack at all. It is important to take into account the effect of non-responses during the evaluation process. Based on the manufacturer’s recommendations, it is crucial to point out conditions, under which a non-response belongs to the classification error rate.
Two chief metrics are used for this:
- Attack Presentation Non-Response Rate (APNRR). It is calculated for each PAIS and also includes the sample size for modeling the computed rate.
- Bona Fide Presentation Non-Response Rate (BPNRR). It includes the sample size to provide the computed rate.
APCER/BPCER Graphical explanation

Generalization Metrics
Generalization metrics include the following:
Half Total Generalization Error Rate (HTGER). It is defined as the Average Classification Error Rate (ACER) computed for all the protocol variants.
HTGER is calculated according to this formula:
[math]\displaystyle{ HTGER=\Bigl(\frac{1}{N_{GP_S}}\Bigr)\sum_{i=1}^{N_{GP_S}}ACER\bigl({GP}_i\bigr) }[/math]
Worst Case Generalization Error Rate (WCGER). This is the "worst case" scenario, which includes the highest or maximum ACER value computed for all the protocol variants.
It is calculated according to this formula:
[math]\displaystyle{ WCGER=\max_{{GP}_S}\Bigl(APCER_{GP}\Bigr) }[/math]
Demographic bias metric (statistical parity)
This metric implies "fair" and unbiased error distribution. It implies that a proportionate amount of errors occur in each demographic group (genders, ages, ethnicities, religions etc.). It is important to ensure demographic parity to provide efficacy and ethical approach to the subject.
To detect lack of demographic parity, Statistical Parity Difference can be employed:
[math]\displaystyle{ SPD = Pr (Y = 1|A = 1) - Pr (Y = 1|A = 0) }[/math]
- [math]Y[/math] denotes a binary predictor.
- [math]A[/math] denotes protected attributes: sex, skin tone, age, etc.
For each specific demographic group the individual Demographic Bias Metric (DBM) can be calculated:
[math]\displaystyle{ DBM=\frac{1}{{\left\vert {DG}_{pairs} \right\vert}{\left\vert {\omega}_{points} \right\vert}}\cdot \textstyle \sum_{j,k\in\{{{DG}_{pairs}}\}} \displaystyle \textstyle \sum_{i\in{\omega_{points}}} \displaystyle\left\vert {{BPCER}(i, j)-{BPCER}(i, k)} \right\vert }[/math]
- [math]{DG}_{pairs}[/math] — A number of demographic group pairs: Male —> Female, Young —> Senior, Dark-skinned —> Light-skinned, etc.
Note: There can be multiple pairs for a single demographic group.
Demographic bias metric (from facial recognition)
To propose a truly bias-free solution, a challenge dubbed Looking at People Fair Face Recognition challenge ECCV2020 was proposed.
To prevent potential ethnicity bias, the following formula was suggested:
[math]\displaystyle{ {Bias}_{EER}=\sum_{e}{ERR}_e-{min}_{e'}{ERR}_{e'} }[/math]
- [math]ERR[/math] — The error metrics APCER, BPCER, or ACER.
- [math]e[/math] — ethnicity.
- [math]e'[/math] — Ethnicity with the lowest ERR value.
- [math]{Bias}_{EER}[/math] — Total bias rate of the algorithm in one metric.
This formula helps to attest an algorithm as fair if only it generates the same ACER metric error rate for all ethnicities.
FAQ
What are liveness standards?
International liveness standards include guidelines and certifications dedicated to the prevention of Presentation Attacks.
Since 2017 two major certifications were designed to:
- Define Presentation Attacks (PAs).
- Set a basis for detecting and preventing PAs.
- Test and asses performance of the biometric systems.
The major standards used are ISO/IEC 30107 standard and FIDO certification. Both documents provide a report on the attack types, establish terminologies and definitions, set appropriate testing conditions, describe detection mechanisms, and present error rates.
In January 2022 a new standard was proposed by the European Union Agency for Cybersecurity (ENISA). The primary focus of this document is remote identity proofing.
What are liveness metrics?
Liveness metrics evaluate the factors contributing to the overall effectiveness of liveness detection and antispoofing. They include: Attack Presentation Classification Error Rate (APCER), Bona Fide Presentation Classification Error Rate (BPCER) and Average Classification Error Rate (ACER) as the evaluation metric, in which APCER and BPCER are used to measure the error rate of fake or live samples, respectively. After analyzing these factors, recognition system developers are able to pinpoint weak spots and vulnerabilities of the system as well as potential security threats and are able to deal with them accordingly.
Find more information about biometric metrics in the article: Performance
Are there any national biometric liveness standards?
France, USA and European Union propose certain biometric liveness standards.
Currently, national legislations barely focus on the biometric liveness standardization. The best known example is a set of ISO standards regarding the issue, specifically ISO/IEC 30107 standard introduced in 2017.
European eiDAS initiative is a regulatory framework dedicated to developing a safe digital environment and reliable electronic IDs. The National Cybersecurity Agency of France (ANSSI) has a Remote Identity Verification Service Providers (PVID) standard to address spoofing.
NIST and American National Standards Institute (ANSI, not to be confused with ANSSI) introduced a standard regulating fingerprint biometric data.
References
- ISO/IEC 19795-1
- ISO/IEC DIS 30107-3
- ISO/IEC 30107-1:2016
- ISO/IEC 30107-3, First edition 2017-09
- An example of the Presentation Attack Species
- ISO/IEC 19989
- BPCER/APCER help to achieve a higher PAD accuracy rate
- Face presentation attack detection. A comprehensive evaluation of the generalisation problem
- Looking at People Fair Face Recognition challenge ECCV2020
- CASIA-SURF CeFA: A Benchmark for Multi-modal Cross-ethnicity Face Anti-spoofing
 Antispoofing